SSD_PERF & FLAME GRAPH INSTRUCTIONS
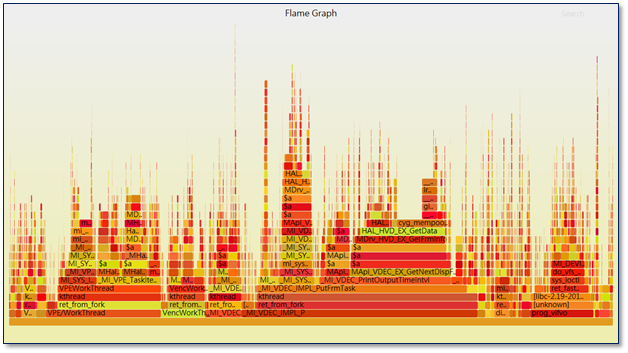
Flame Graph provides visual performance analysis, presented in SVG format, supports zooming, and can quickly locate CPU performance bottlenecks. Flame Graph counts the proportion of time the code-path is executed during the sampling period. The vertical axis is the code-path, and it is the call stack generally from the bottom to the top. The horizontal axis is the occupancy time of a certain stack. The larger the span, the higher the proportion of CPU it occupies, that is, the most CPU-intensive. The stacks are arranged in alphabetical order on the horizontal axis. The color depth is only for distinction, nothing special significance.
The following is the Flame Graph generation process:
-
Use perf to get system execution status
-
Step 1:Execute perf record on EVB
# ./perf record -a -g sleep 10

-a : CPU

-o : Specify the output file, if not, it will be automatically saved in the current directory, named perf.data

-g : Record call stack

sleep : Specify the duration. Unit: second
If it displays during execution, it means that the system lacks GCC runtime library, please put libgcc_s.so.1 under /mnt or other path, and add it to LD_LIBRARY_PATH.
# export LD_LIBRARY_PATH=/mnt:/lib
-
Step 2:Execute perf report to analyze the saved data
# ./perf report
Display the call stack and running time ratio of each leaf function directly on the console.
If FlameGraph analysis is performed directly, perf report is not necessary.
-
-
Use data to generate flame graphs
-
Step 1:Execute
perf scripton EVB to parse the data and archive the output result to p1# ./perf script -i perf.data > p1
-
Step 2:Switch to PC, click to get FlameGraph, execute
stackcollapse-perfprovided by FlameGraph on PC to fold the symbols of p1 and save it to disk# stackcollapse-perf.pl p1 &> perf.folder
-
Step 3:Execute p1 provided by FlameGraph on the PC to convert
perf.foldertosvg, which can be opened with a browser (Chrome or Firefox is recommended)# flamegraph.pl perf.folder > perf.svg
Generate Flame Graph command:
./perf record -a -g -F 2599 -p 451 sleep 30
./perf script -i perf.data > p1
./stackcollapse-perf.pl p1 &> perf.folder
./flamegraph.pl perf.folder > perf.svg
-
Reference: